Org Resource Manager
Introduction
The Metrics Report System provides a comprehensive view of compute resource usage across clusters and subjects. It fetches real-time data from:
- OrgResourceQuota Database – Subject allocations
- Global Cluster Metrics DB – Aggregated cluster metrics
- Subject Metrics DB – Subject-level resource usage
- Subjects DB – Subject metadata
Metrics are accessible through both a REST API and a WebSocket interface, with internal coordination between multiple microservices and databases.
Architecture
The Org Resource Manager and Autoscaler architecture is organized into three major subsystems, each responsible for a distinct aspect of compute resource governance: quota lifecycle management, real-time metric aggregation, and scaling decision execution. These components operate in a loosely coupled, event-driven architecture using shared databases, streaming interfaces, and message queues for coordination.
The architecture supports both push-based real-time updates and pull-based configuration workflows, enabling it to scale effectively across diverse organizational deployments.
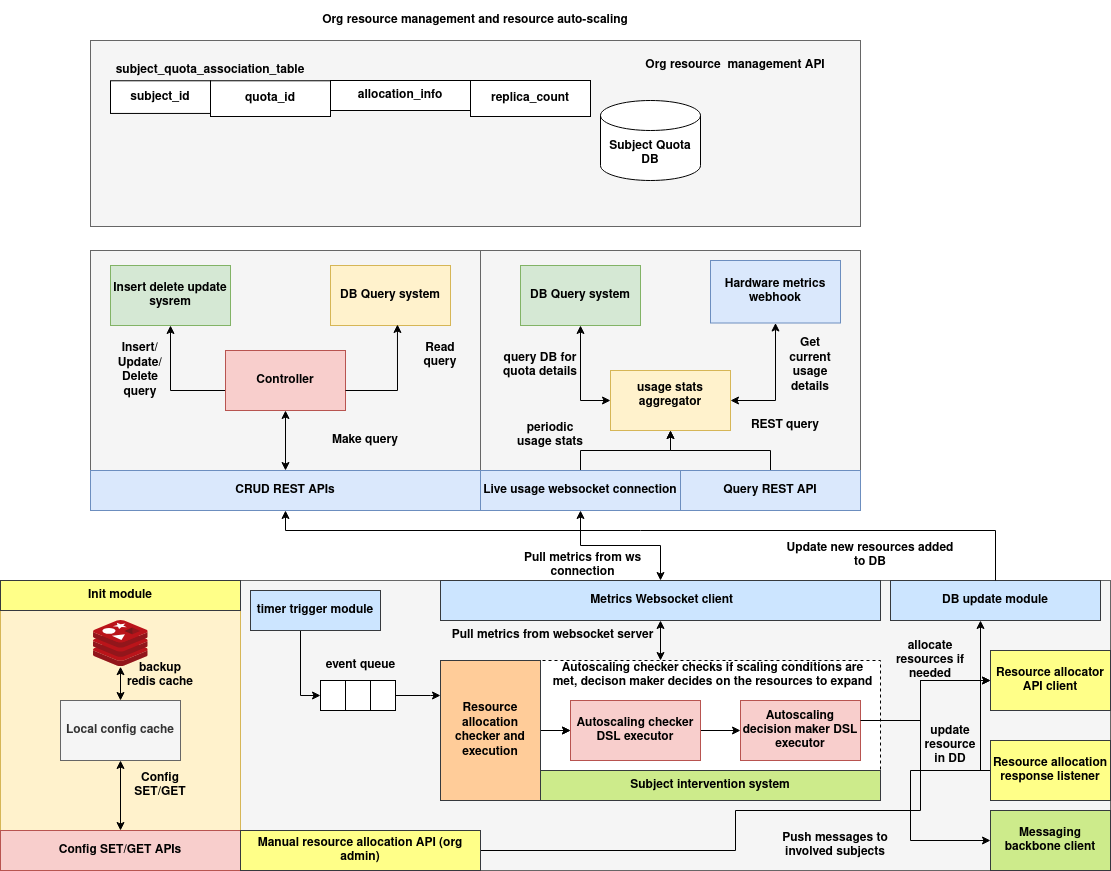
1. Resource Management API Layer
This layer provides the foundational API interface for managing subject-level resource quotas and exposing resource metadata.
Components
-
Subject Quota DB A persistent data store that tracks resource allocation per subject. Each record is mapped using a unique
quota_id, and includes metadata such asreplica_countand allocation policies. -
CRUD Controller An internal controller module that processes create, update, and delete operations and interfaces with the DB query system. It is accessed via RESTful endpoints exposed to external clients.
-
DB Query System Provides indexed access to stored quota data for read-only operations or quota report generation.
-
Live WebSocket Publisher Pushes real-time snapshots of current quota states to subscribers, ensuring clients receive up-to-date allocation metrics without polling.
Interaction
Clients interact with this layer primarily via the /quota REST endpoints for static quota management and via the WebSocket feed for continuous updates.
2. Metrics Aggregation and Reporting Layer
This layer is responsible for collecting, normalizing, and reporting real-time usage data for both individual subjects and entire clusters.
Components
-
Hardware Metrics Webhook Receives usage reports from external hardware or monitoring agents. These include real-time CPU, memory, and GPU utilization across nodes or clusters.
-
Usage Stats Aggregator Central service that merges subject-level usage with cluster-wide metrics and periodically refreshes usage records in the Subject Quota DB if inconsistencies are detected.
-
Metrics WebSocket Client Subscribes to a backend metrics stream and forwards usage snapshots to the autoscaler and other internal modules.
-
Query REST API Layer Allows external clients to query current cluster and subject metrics. For example,
/metrics/reportreturns a merged view of all relevant usage statistics. -
DB Update Module Synchronizes any modified resource metrics or updated replica counts to persistent storage to maintain consistency between reported and allocated states.
Interaction
This layer maintains a continuous monitoring loop. Metrics are either pulled via webhooks or streamed over WebSocket, and the aggregator reconciles this data with DB records for visibility and actionability.
3. Autoscaling and Allocation Layer
The autoscaler layer evaluates system state using DSL-based workflows and dispatches resource allocation commands when scaling conditions are met.
Components
-
Timer Trigger Module Initiates periodic autoscaler evaluations by emitting events at a configured interval.
-
Subject Intervention System The core decision-making system, composed of:
-
Autoscaling Checker DSL Executor: Evaluates if current conditions meet autoscaling thresholds.
-
Autoscaling Decision Maker DSL Executor: Determines the appropriate replica count for each subject based on defined policies.
-
Resource Allocator API Client Issues formal allocation requests to the compute backend or resource manager.
-
Resource Allocation Response Listener Subscribes to a NATS message bus and listens for allocation confirmations. Each response is correlated with a pending allocation request.
-
Messaging Backbone Client Publishes allocation outcomes to the appropriate clients or downstream systems, completing the feedback loop.
-
Manual Resource Allocation Interface Allows an admin to manually trigger resource updates using a dedicated WebSocket interface. The system ensures the response is routed and delivered through the same communication channel.
Interaction
The autoscaler layer supports both automated periodic scaling and ad-hoc interventions. In both cases, usage metrics feed into a DSL-based evaluator, and any change in allocation is issued through the allocator API and confirmed via NATS.
Supporting Infrastructure
-
Init Module On system startup, this module loads configuration from Redis (as primary) and a local fallback cache. It also manages runtime settings used by the autoscaler.
-
Redis Cache Provides backup persistence for system configuration and transient state, such as active WebSocket sessions and unresolved allocation requests.
-
Configuration APIs A set of endpoints (
/autoscale/config,/autoscale/interval) to manage scaling thresholds, DSL execution parameters, and scheduler behavior.
Communication Channels
| Interface Type | Purpose |
|---|---|
| REST APIs | Expose static configuration and quota management interfaces |
| WebSocket | Stream live metrics and support interactive admin commands |
| Redis | Serve as a cache layer for config, backups, and connection state |
| NATS Messaging | Asynchronous pipeline for allocation request/response coordination |
Execution Summary
- Quotas are created or modified via the Resource Management API.
- Metrics are streamed continuously through the Aggregation Layer.
- Periodic events trigger autoscaling evaluation in the Decision Layer.
- If required, allocations are dispatched, confirmed, and persisted.
- Both clients and administrators are notified via WebSocket or messaging backbones.
This decoupled, modular design ensures the system remains resilient, scalable, and extensible, capable of supporting both automated workflows and human-in-the-loop operations.
Schema
OrgResourceQuota
from dataclasses import dataclass

@dataclass
class OrgResourceQuota:
    subject_id: str = ''
    quota_id: str = ''
    allocation_info: str = ''
    replica_count: str = ''
| Field | Type | Description |
|---|---|---|
subject_id |
str | Unique identifier of the subject |
quota_id |
str | Unique identifier for the quota entry |
allocation_info |
str | Metadata or policy explaining the allocation |
replica_count |
str | Number of replicas assigned to this subject |
REST API Documentation
GET /metrics/report
Description: Returns the full consolidated metrics report including cluster-wide metrics and all subject data and usage metrics.
Response Structure:
{
  "success": true,
  "data": {
    "cluster_metrics": { ... },
    "subjects": {
      "data": { "subject_id": { ... } },
      "metrics": { "subject_id": { ... } }
    }
  }
}
cURL Example:
curl -X GET http://localhost:8000/metrics/report
OrgResourceQuota APIs
POST /quota
Description: Creates a new quota entry.
Request Body:
{
  "subject_id": "subject-001",
  "quota_id": "quota-001",
  "allocation_info": "gpu-allocation",
  "replica_count": "3"
}
cURL Example:
curl -X POST http://localhost:8000/quota \
     -H "Content-Type: application/json" \
     -d @quota.json
GET /quota/<quota_id>
Description: Fetches a specific quota entry.
cURL Example:
curl http://localhost:8000/quota/quota-001
PUT /quota/<quota_id>
Description: Updates an existing quota.
Request Body:
{
  "replica_count": "5"
}
cURL Example:
curl -X PUT http://localhost:8000/quota/quota-001 \
     -H "Content-Type: application/json" \
     -d '{"replica_count": "5"}'
DELETE /quota/<quota_id>
Description: Deletes a specific quota entry.
cURL Example:
curl -X DELETE http://localhost:8000/quota/quota-001
POST /quotas
Description: Queries multiple quota entries.
Request Body:
{
  "subject_id": "subject-001"
}
cURL Example:
curl -X POST http://localhost:8000/quotas \
     -H "Content-Type: application/json" \
     -d '{"subject_id": "subject-001"}'
Cluster Metrics API
GET /cluster/<cluster_id>
Description: Returns cluster-wide metrics such as total CPU, memory, and GPU utilization.
cURL Example:
curl http://localhost:8888/cluster/cluster-001
Response:
{
  "success": true,
  "data": {
    "total_cpu": 128,
    "used_cpu": 67.5,
    "total_memory": 102400,
    "used_memory": 67800
  }
}
Subject Metrics API
GET /subjects
Description: Returns real-time usage metrics for all known subjects.
cURL Example:
curl http://localhost:8891/subjects
Response:
{
  "success": true,
  "data": [
    {
      "subject_id": "subject-001",
      "cpu_usage": 8.4,
      "memory_usage": 5120
    }
  ]
}
Subjects DB API
GET /subjects?subject_id=<id1>&subject_id=<id2>
Description: Returns metadata for one or more subject IDs.
cURL Example:
curl -G http://localhost:8892/subjects \
     --data-urlencode "subject_id=subject-001" \
     --data-urlencode "subject_id=subject-002"
Response:
{
  "success": true,
  "data": [
    {
      "subject_id": "subject-001",
      "name": "Trainer-A",
      "type": "gpu-node"
    }
  ]
}
WebSocket Subscription
Endpoint
ws://<host>:8765/?interval=<seconds>
Description
Connects to the metrics reporting service and pushes a complete report every interval seconds. The message payload is identical to the /metrics/report REST API.
Query Parameters
| Name | Type | Default | Description |
|---|---|---|---|
interval |
int | 30 | Time in seconds between consecutive push updates. |
Example Usage (with websocat)
websocat "ws://localhost:8765/?interval=60"
Example Usage (JavaScript)
const ws = new WebSocket("ws://localhost:8765/?interval=15");

ws.onmessage = function(event) {
    const report = JSON.parse(event.data);
    console.log("Received metrics report:", report);
};
OrgAutoscaler Documentation
Introduction
OrgAutoscaler is a dynamic autoscaling engine designed to:
- Periodically execute a DSL-based policy workflow to evaluate scaling needs.
- Trigger subject-level resource allocation using DSL workflow results.
- Support ad-hoc scaling through a WebSocket interface.
- Listen for allocation confirmation messages via NATS and route them back to requestors.
It integrates with:
- Flask for configuration and control
- WebSockets for live autoscaling requests
- NATS for async response delivery
- A central DSL executor for autoscaling logic
2. Autoscaler Flow Explanation
Periodic Execution Flow
- A background
Timersends an"activate"message every N seconds. -
A background listener thread picks up the event and:
-
Calls
get_metrics_report()fromQuotaClient - Feeds the metrics into the DSL executor
- Expects a result in the form:
{ subject_id: replica_count } - Each result is sent to
SubjectResourceAllocator, which pushes the allocation request. - Allocation responses are published to a NATS topic:
<ORG_ID>__alloc_response
5. The AllocationResponseListener listens on this topic and pushes responses into a shared response queue.
Ad-hoc Execution Flow (WebSocket)
- A WebSocket client connects and sends:
json
   {
     "subject_id": "subj-123",
     "replica_count": 4
   }
2. The autoscaler:
- Attaches a unique UUID
- Stores the WebSocket connection in a dictionary:
connections[uuid] - Sends the allocation request
-
When a NATS response with the same UUID arrives:
-
The router thread finds the matching socket
- Sends the response back
- Closes the WebSocket connection
Autoscaler APIs
POST /autoscale/config
Set DSL execution parameters dynamically.
Request
{
  "incr": 2,
  "threshold": 0.7
}
Response
{
  "success": true,
  "message": "Configuration updated"
}
GET /autoscale/config
Fetch current DSL parameters.
Response
{
  "success": true,
  "data": {
    "incr": 2,
    "threshold": 0.7
  }
}
POST /autoscale/interval
Set the autoscaler execution interval (in seconds).
Request
{
  "interval": 60
}
Response
{
  "success": true,
  "message": "Interval updated"
}
GET /autoscale/interval
Get the current autoscaler interval.
Response
{
  "success": true,
  "data": {
    "interval": 60
  }
}
WebSocket API – Ad-hoc Autoscaling
Connect
ws://<host>:6789
Send
{
  "subject_id": "subject-xyz",
  "replica_count": 3
}
Receive (on success)
{
  "success": true,
  "response": {
    "uuid": "123e4567...",
    "response": {
      "status": "allocated",
      "replicas": 3
    }
  }
}
Receive (on timeout)
{
  "success": false,
  "error": "Timeout waiting for response"
}